The benefits of visual communication in business analysis
In the previous post we’ve established that the success of business analysis hinges on communication, and postulated that visual communication is the easiest way to improve productivity and the effectiveness of communication.
It is a cliche that a picture is worth a thousand words. The reality is more complex than that of course. Sometimes a picture provides a lot of insight, and sometimes it hurts comprehension instead. However, when used correctly, the value of visual communication is undeniable.
Let’s look at a couple of examples comparing visual and non-visual communication.
Compare this statement
The Antarctic ice sheet is losing mass at a rate of 152 cubic kilometers (approx. 139 billion tonnes) per year.
with this image:

Yep, that’s New York on the right of the picture. Both examples are based the same data, but the image makes it a lot easier to grasp just how much ice is melting. In fact, most people probably won’t comprehend the numbers at all because they have nothing to relate them to.
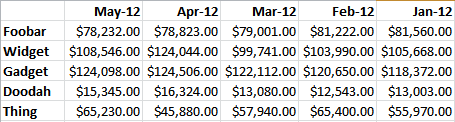
Here is another example. Let’s say you need to see how different products your company sells perform month over month. You can look at this:
or this:
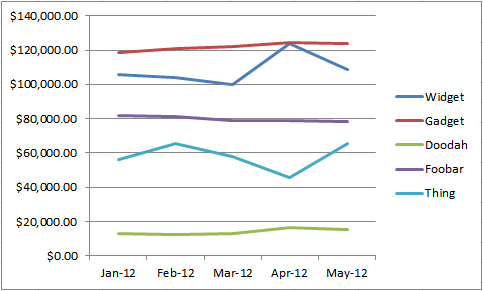
At first glance, the table is just a mass of numbers, whereas with the chart you can immediately see that the sales of Widgets and Things fluctuate a lot, Gadgets and Doodahs show slow steady growth, and Foobars are flatlining. It hardly takes any time at all to see those things.
The same idea applies in business analysis. People prefer visual information because it’s quicker and easier. Let’s face it, who wants to read long documents?
The benefits of visual communication for a business analyst include:
- A higher success rate in communicating complex concepts
- Reducing the barriers to understanding
- Spending less time on delivering the message
- More satisfied stakeholders
Words and numbers are great for describing details. Visuals are great for communicating concepts and often for analysis. Areas that lend themselves well to visualisation include these:
- Numeric data
- Process descriptions
- Hierarchical information
- System descriptions
If you go down the path of using diagrams and charts, it’s a good idea to keep in mind that it can take longer to create a visual message compared to text. There is a break-even point below which text is quicker.
Also, a badly constructed image or a diagram can easily become misleading. It takes thought and experience to construct a good visual.
When describing systems and processes, one approach that simplifies the task is using a consistent set of symbols. There are standardised sets of symbols such as UML or BPMN.
However, they have a problem. Business analysts have to interact with a variety of people in different roles. Most importantly, it includes those who are following the processes and using the systems, the business users. While project managers or software architects may be familiar with UML and BPMN, business users most likely aren’t, so these formal sets of symbols are of limited use.
We believe that when it comes to visuals, the key to effectiveness is to keep things simple and largely informal. Of course, it may be easier said than done. If you’d like a bit of help, we’ve developed a visual communication guide for business analysts.
Finally, I encourage you to consider where you and the people you work with could benefit from the use of diagrams and charts to communicate better and faster. Good luck!

New! We have published a new book: A Navigator to Business Analysis.
Over 400 pages of practical, useful material will help you build your skills and advance your career! Find out more and get free excerpt.
Free course: BABOK 3 Navigation Maps
Subscribe and get an overview of the knowledge areas in BABOK 3. (Very occasionally, we may let you know about discounts and specials).