The structure of the BABOK knowledge areas
We are starting a series of posts to illustrate the structure of the BABOK, and the interconnections between the different knowledge areas within it, and the links between the elements within knowledge areas.
Beachcamp: Day 1
It’s almost summer here in New Zealand, a season for holidays, camping and spending time at the beach. We’re starting a series of posts called Beach Camp to match the season. The goal of the series is to show the structure of each knowledge area presented in the BABOK® 2.0. We hope that it will help you clarify your knowledge and make it more systematic. We will publish the series over the next 2-3 months.
I quite often hear from people learning business analysis that they find it difficult to visualise how the parts of the BABOK align with each other. To address this issue, I’ve created an atlas of maps to help navigate the BABOK. These maps show the internal structure of each knowledge area and illustrate links between the elements within the knowledge area, as well as how it’s related to other knowledge areas.
Before we dive into specific knowledge area maps, this post provides the big picture of all knowledge areas.
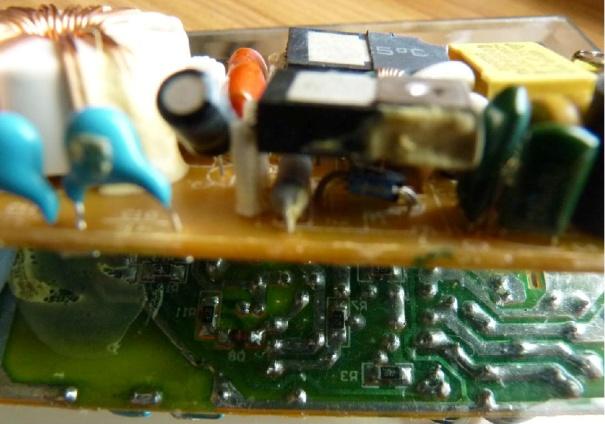
I used to be an electronic engineer and I spent a lot of time developing and assembling sound amplifiers and sound speaker systems as a hobby. Printed circuit boards (PCBs) were used in many of them, helping to assemble and connect the different components into a working unit. PCBs are a good analogy for explaining the structure of the BABOK.
It has six knowledge areas with multiple tasks within each of them, linkages between tasks, their inputs and outputs. However, the visible picture of the six knowledge areas leaves some questions unanswered. An attentive reader of the BABOK 2.0 will certainly notice these areas. This series aims to fill in the gaps.
In the diagram below, I’ve illustrated the internal links within knowledge areas and showed the interconnections between different areas.
Seeing all these links in one page helps in grasping the essence of business analysis and getting a holistic perspective of all the tasks involved, as well as understanding when and why each task is performed in the certain knowledge area.
I’ve highlighted each knowledge area with a colour to make it easier to track links. All the knowledge domains and information external to business analysis (as defined in the BABOK) is shown in red.
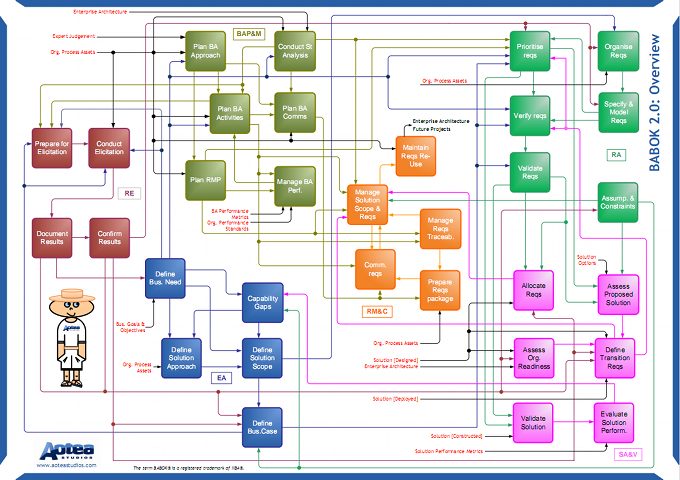
The names of knowledge areas are shown as abbreviations:
- BAP&M: business analysis planning & monitoring
- RE: requirements elicitation
- RA: requirements analysis
- RM&C: requirements management & communication
- EA: enterprise analysis
- SA&V: solution assessment & validation
If you found this post useful, please share it with other people!

New! We have published a new book: A Navigator to Business Analysis.
Over 400 pages of practical, useful material will help you build your skills and advance your career! Find out more and get free excerpt.
Get helpful BA articles in your inbox
Hone your skills with BA insights (and very occasionally, we may let you know about discounts and specials).